
In 2013, I created my Global Equities Momentum (GEM) model. It holds U.S. or non-U.S. stock indices when stocks are strong and uses bonds as a safe harbor when stocks are weak.
When my book, Dual Momentum Investing, was published in 2014, I had Barclays bond index data back to 1973. Since one year of data is needed to initialize the GEM model, results went from 1974 through 2013. In 2015, I got access to Ibbotson Intermediate Government bond data. This allowed me to extend GEM back to 1970.
The extra bond data lets us see how GEM performed during the 1973-74 bear market. GEM was up 20% in those two years, while the S&P 500 index was down over 40%. This was a short but impressive out-of-sample validation of my dual momentum approach.
I thought 1971 was as far back as I could ever take GEM because MSCI non-U.S. stock index data only went back to 1970. But I recently got access to long-term Global Financial Data (GFD) going back much further.
Global Investing
We want as much data as we can get to confirm an investment strategy. But we also have to consider how realistic our results will be under earlier conditions. Global investing, for example, makes little sense during the two World Wars. In WWI, there were strict capital controls that made it almost impossible to invest globally. These eased up a bit during the 1920s. But they strengthened again during the Great Depression. During WW II, they were the strongest that they had ever been.
Even if you could have invested globally back then, it would have made little sense to do so. Imagine as a U.S. investor you went to a cocktail party and said you bought German, Italian, or Japanese stocks. You would never get invited to another party. As an institutional investor, you would have lost all your clients.
Even if you had invested globally then, it would have been imprudent. Right after WW II, German stocks lost 91% of their value, and Japanese stocks dropped 97%. Governments did not know how to manage their economies prior to WW II. In the U.S., the government made the Great Depression worse by austerity measures and by not having social safety nets and safeguards like the FDIC or SPIC to protect the public.
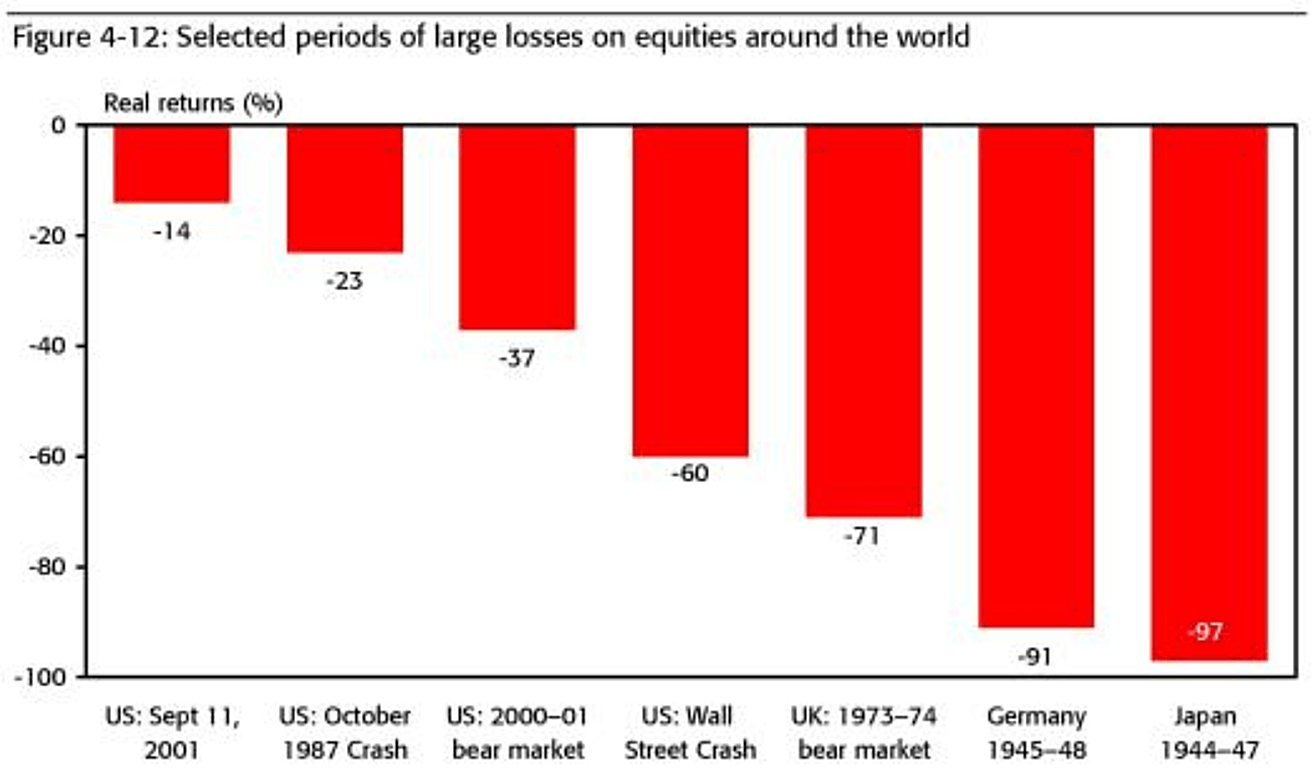
Source: Dimson, Marsh & Staunton, Triumph of the Optimists:101 Years of Global Investment Returns, Princeton University Press, 2002
So, what is a good starting date for global investing? The first academic paper to point out the benefits of international investing was in 1968 [1]. There were similar papers in 1970 and 1974 [2]. The first mutual fund to make global investing available to U.S. investors was the Templeton Growth Fund which began in 1954. Asness, Israelov, and Liew (2017) in “International Diversification Works (Eventually)” begin their study in 1950 using GFD data. This seems to be a reasonable starting time. So GEM results will begin in January 1950.
Data Sources
We use the S&P 500 index for U.S. stocks. For non-U.S. stocks, we use the MSCI All Country World Index ex-U.S. from its start date in January 1989. It includes both developed and emerging markets. By using as broad an index as possible, we avoid selection bias. Before 1989, we use the MSCI World Index ex-U.S. from its start date of January 1970, and the GFD World Index ex-U.S. before then. For bonds, we use the Barclays U.S. Aggregate Bond Index from its start in January 1973. Before 1973, we use the Ibbotson Intermediate Government Index of 5-year bonds.
GEM Model
Geczy & Samonov (2015) show that momentum consistently outperformed buy-and-hold back to the year 1801. Momentum applied to geographically diversified stock indices outperformed momentum applied to stocks, bonds, commodities, currencies, and sectors. That is how we use momentum.
When the trend of stocks is up according to absolute momentum applied to the S&P 500, we use relative strength to determine if we will be in U.S. or non-U.S. stocks. When the trend of stocks is down, we invest in bonds. We use a 12-month lookback period for both types of momentum and rebalance monthly.
It is not difficult to design models that look good in hindsight. But you cannot judge the probability of something happening based on fitting past data. Most investors do not understand this. You need to instead look at results out-of-sample.
A 12-month look back was effective in Cowles & Jones’ 1937 study of momentum. It also worked best in the Jegadeesh & Titman (1993) seminal study on relative momentum and in the Moskowitz et al. (2012) seminal study on absolute (time series) momentum.
A 12-month momentum lookback soundly beat buy-and-hold from the beginning of stock market trading in the 1600s and when applied to other assets back to 1223 as reported by Greyserman & Kaminski (2014).
Tobias Moskowitz, a respected momentum researcher, said, “Momentum is a phenomenon that exists at 6 to 12-month horizons.” [3] Most academic papers on stock market momentum use a 6 or 12-month lookback. We prefer 12-months because there is more out-of-sample evidence supporting it. It also has fewer trades and is more tax-efficient than shorter lookbacks.
GEM Results
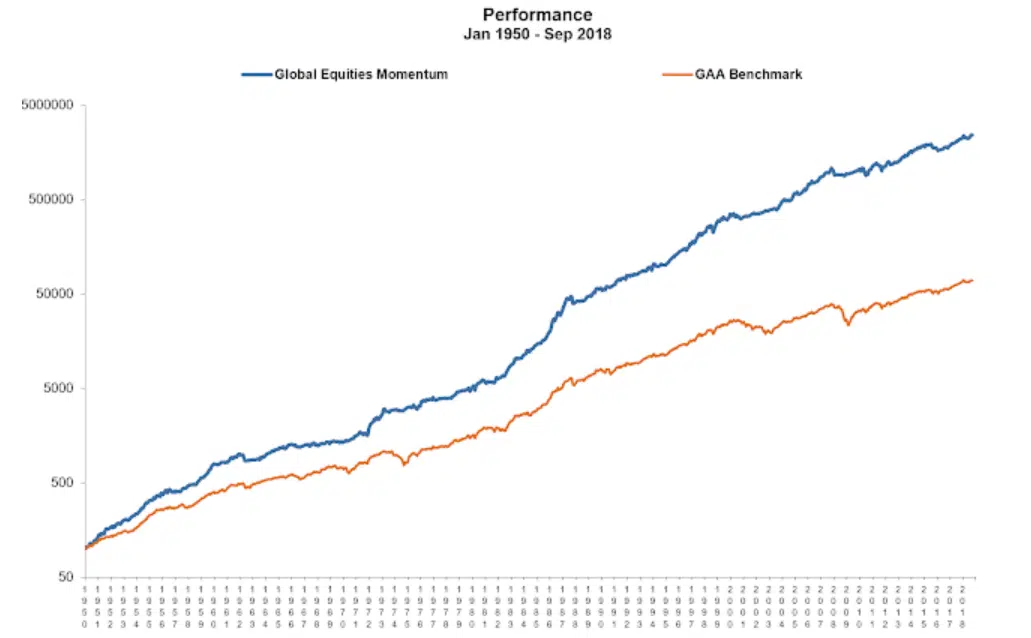
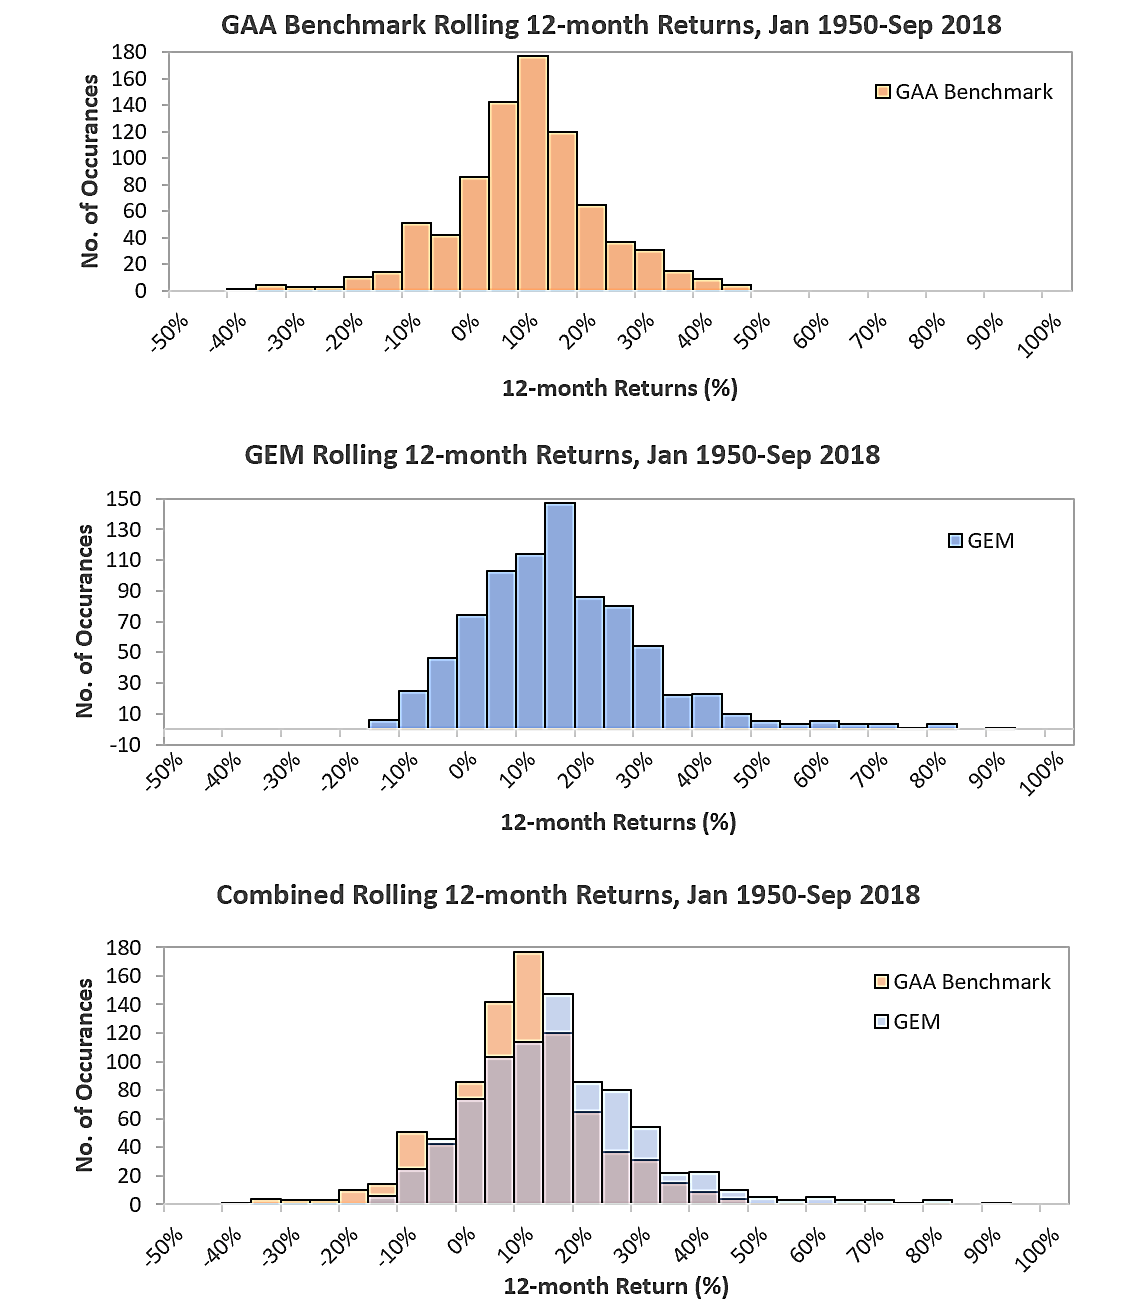
Here are GEM results compared to a global asset allocation (GAA) benchmark of 45% in U.S. stocks, 28% in non-U.S. stocks, and 27% in 5-year bonds. These percentages reflect the amount of time GEM spent in each of these markets. It is also representative of a typical global asset allocation portfolio.
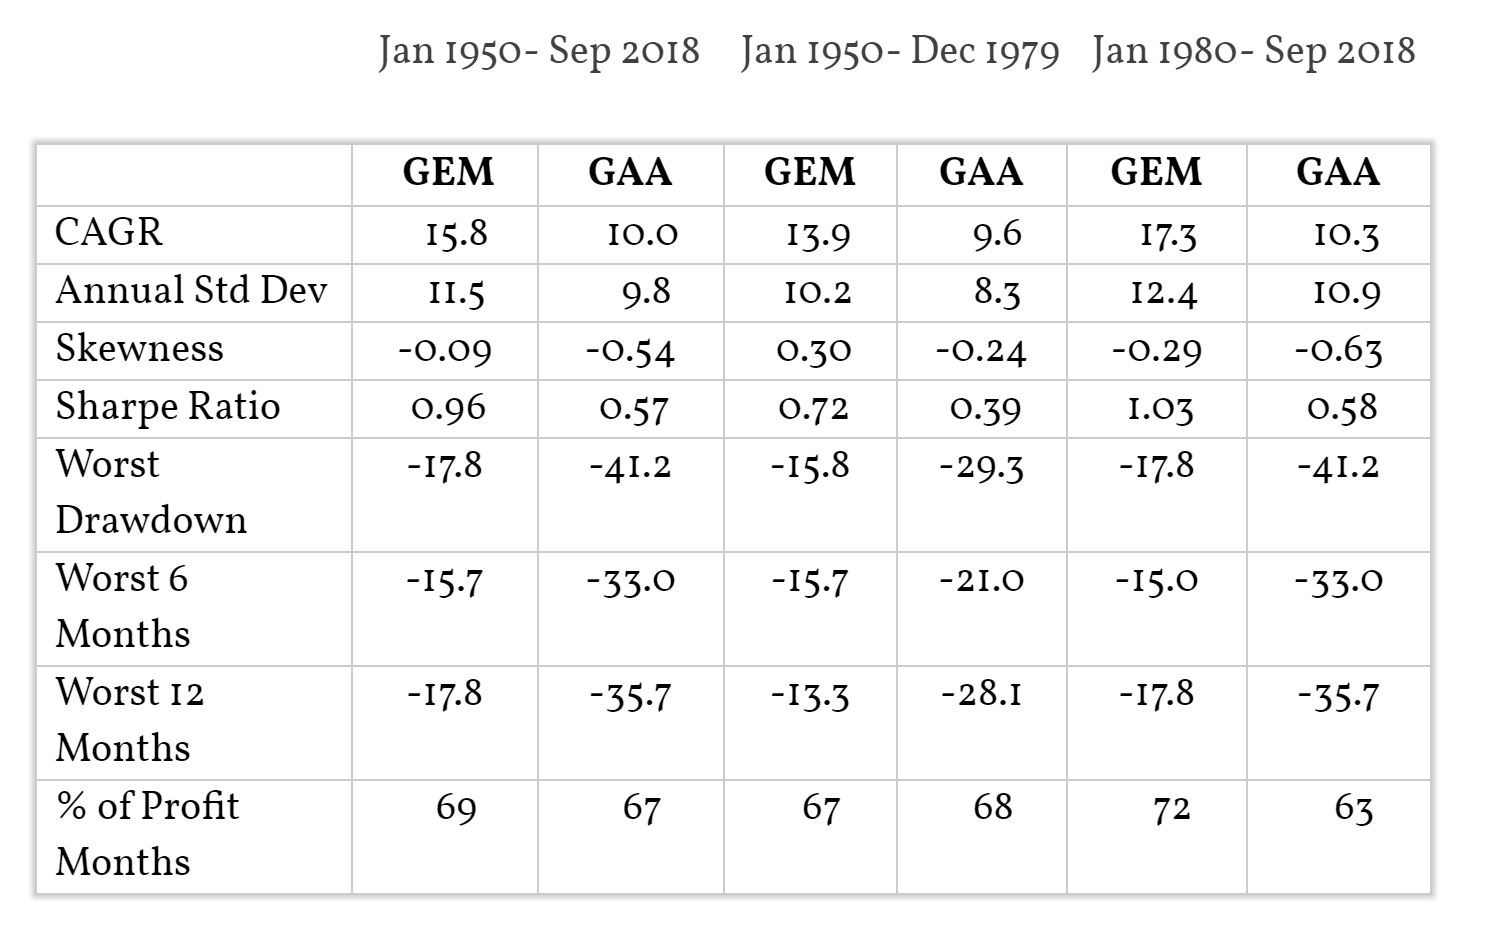
Results are hypothetical, are NOT an indicator of future results, and do NOT represent returns that any investor actually attained. Indexes are unmanaged, do not reflect management or trading fees, and one cannot invest directly in an index. Please see our Disclaimer page for more information.
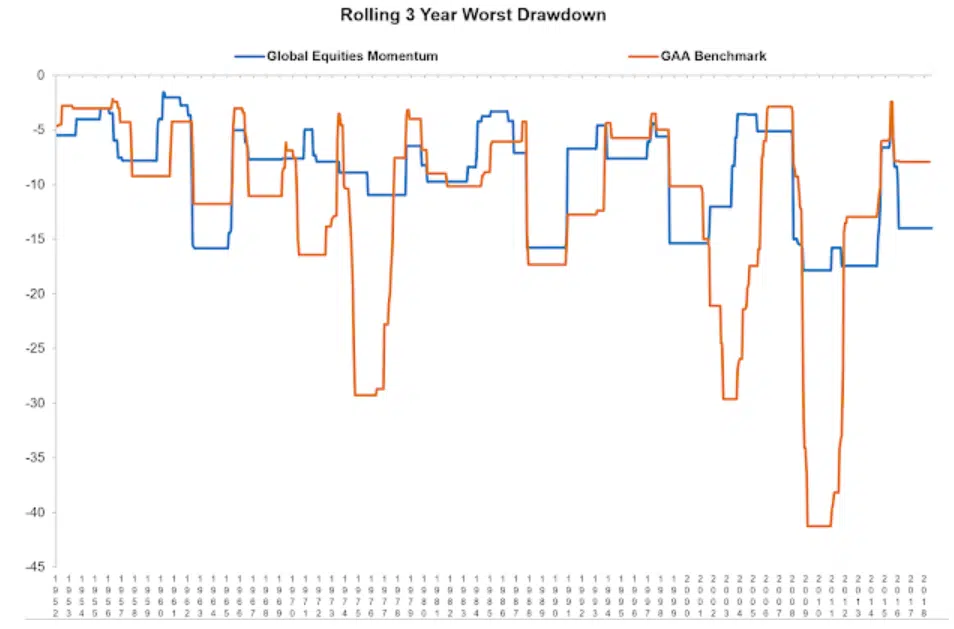
 The correlation in monthly returns between GEM and GAA is 0.60 and between GEM, and the S&P 500 is 0.50. There were on average only 1.5 trades per year with GEM. So transaction costs would have been minimal.
These results are updated monthly on the Performance pages of my website.
Relative versus Absolute Momentum
To better understand what is going on with GEM, I separated out its two components, relative and absolute momentum.
| GEM | REL MOM | ABS MOM | S&P 500 | |
| CAGR | 15.8 | 13.4 | 12.3 | 11.4 |
| Annual Std Dev | 11.5 | 14.4 | 11.2 | 14.2 |
| Sharpe Ratio | 0.96 | 0.64 | 0.70 | 0.52 |
| Worst Drawdown | -17.8 | -54.6 | -29.6 | -51.0 |
| Worst 6 Months | -15.7 | -41.8 | -25.2 | -41.8 |
| Worst 12 Months | -17.8 | -48.1 | -25.3 | -43.3 |
| % of Profit Months | 69 | 65 | 67 | 64 |
Results are hypothetical, are NOT an indicator of future results, and do NOT represent returns that any investor actually attained. Indexes are unmanaged, do not reflect management or trading fees, and one cannot invest directly in an index. Please see our Disclaimer page for more information.
Relative momentum is where we switch between U.S. and non-U.S. stocks based on relative strength. Relative momentum still suffers from equity-like drawdowns. But for investors with a mandate to always be in equities, relative momentum gave 200 basis points more in annual return than the S&P 500.
Absolute momentum had 90 basis points more in annual return than the S&P 500. Its lower return than relative momentum is due to occasional whipsaws and lags in getting in or out of equities at their turning points. But absolute momentum gave reduced drawdowns.
There is a synergy in combining both types of momentum. The combined whole is greater than the sum of the parts. If you reduce bear market exposure using absolute momentum, you gain more from relative momentum in bull markets. For example, the average bear market loss of the S&P 500 since 1950 was 33%. It takes a 50% gain to recoup that size loss, and the stock market gains about 10% per year. So, it can take 5 years on average to reach breakeven. If absolute momentum substantially reduces bear market losses, then bull market gains become new profits instead of making up losses. That is why GEM shows an impressive 440 basis point increase in annual return above the S&P 500 from 1950 until now, versus 200 basis points for relative momentum and 90 basis points for absolute momentum. As with absolute momentum, GEM returns were achieved with considerably reduced downside exposure.
Here are tables showing how absolute and relative momentum performed during bull and bear market cycles.
| BULL MARKETS | S&P 500 | ABS MOM | GEM |
| Jan 1950-Dec 1961 | 647.7 | 608.3 | 1014.6 |
| Jul 1962-Nov 1968 | 143.7 | 66.7 | 58.0 |
| Jul 1970-Dec 1972 | 75.6 | 47.2 | 84.0 |
| Oct 1974-Dec 1980 | 198.3 | 91.6 | 103.3 |
| Aug 1982-Aug 1987 | 279.7 | 246.3 | 567.2 |
| Dec 1987-Aug 2000 | 816.6 | 728.4 | 730.5 |
| Oct 2002-Oct 2007 | 108.3 | 72.1 | 181.6 |
| Mar 2009-Dec 2017 | 338.7 | 177.0 | 142.3 |
| AVERAGE | 326.1 | 254.8 | 360.4 |
| BEAR MARKETS | S&P 500 | REL MOM | GEM |
| Jan 1962-Jun 1962 | -22.8 | -18.5 | -15.7 |
| Dec 1968-Jan 1970 | -29.3 | -13.9 | 4.3 |
| Jan 1973-Sep 1974 | -42.6 | -35.6 | 15.1 |
| Dec 1980-Jul 1982 | -16.5 | -16.9 | 16.0 |
| Sep 1987-Nov 1987 | -29.6 | -15.1 | 15.1 |
| Sep 2000-Sep 2002 | -44.7 | -43.4 | 14.9 |
| Nov 2007-Feb 2009 | -50.9 | -54.6 | -13.1 |
| AVERAGE | -33.8 | -28.3 | 0.9 |
Results are hypothetical, are NOT an indicator of future results, and do NOT represent returns that any investor actually attained. Indexes are unmanaged, do not reflect management or trading fees, and one cannot invest directly in an index. Please see our Disclaimer page for more information.
Absolute momentum gave less profit than the S&P 500 during bull markets. But dual momentum-based GEM produced more profit. Relative momentum by itself suffered nearly the same bear market losses as the S&P 500. But GEM, over the long run, eliminated those losses over this 68-year period.
Core Versus Satellite
Fama and French call momentum “the premier anomaly.” With the growth in factor-based investing, more investors are now willing to add momentum to their portfolios.
Trend following has also been gaining traction. Academic research on trends over the past few years has switched from hostility to skepticism to acceptance.
More often than not, those who invest in momentum or trend use it as a satellite rather than as a core holding. This may be due to anchoring or familiarity bias. There can also be a strong home country bias that reduces investing in non-U.S. stocks. Some investors may not yet fully appreciate dual momentum as a more dynamic rather way to diversify. Others might have a long-standing prejudice against timing stock market entries and exits.
For investment professionals, there is also career risk. All strategies that diverge from the market will at times underperform. If you lose money when everyone else is losing money, you will probably hold on to your clients. But all that changes if you are doing something different and then lose money when others do not.
Ironically, the biases that keep investors away from dual momentum are reasons why it works as well as it does. The behavioral explanation of momentum starts with underreaction to relevant information.
You can never be sure of the future, and there will always be tracking errors when you deviate from a benchmark portfolio. So we can understand those who are comfortable having multiple investments. Here are some allocation scenarios to consider. They show GEM combined with GAA over the past 68 years.
| GEM | 75%/25% | 50%/50% | 25%/75% | GAA | |
| CAGR | 15.8 | 14.4 | 13.0 | 11.5 | 10.0 |
| Annual Std Dev | 11.5 | 10.4 | 9.8 | 9.7 | 9.8 |
| Sharpe Ratio | 0.96 | 0.92 | 0.85 | 0.73 | 0.57 |
| Worst Drawdown | -17.8 | -21.2 | -28.1 | -34.9 | -41.2 |
| Worst 6 Months | -15.7 | -14.6 | -17.00 | -25.3 | -33.0 |
| Worst 12 Months | -17.8 | -21.2 | -24.6 | -28.0 | -35.7 |
| % of Profit Months | 69 | 69 | 68 | 68 | 67 |
Results are hypothetical, are NOT an indicator of future results, and do NOT represent returns that any investor actually attained. Indexes are unmanaged, do not reflect management or trading fees, and one cannot invest directly in an index. Please see our Disclaimer page for more information.
For more details about GEM or dual momentum, see my book.
[1] Grubel (1968), “Internationally Diversified Portfolios: Welfare Gains and Capital Flows”
[2] Levy & Sarnat (1970), “International Diversification of Investment Portfolios,” Solnik (1974), “Why Not Diversify Internationally Rather Than Domestically?”
[3] Moskowitz (2010), “Momentum Investing: Finally Accessible for Individual Investors,” Investments Wealth Monitor