Years ago when I first started studying momentum, two things stood out to me. The first was that most momentum research focused on cross-sectional stock studies. These looked at the future performance of stocks that had been strong versus stocks that had been weak. This was what interested academics most, since abnormal profit from strong versus weak stocks was relevant to whether the stock market was efficient.
Researchers have now done extensive out-of-sample validation testing of momentum.[1] As a further check on the robustness of cross-sectional stock momentum, researchers have looked at relative strength momentum applied to other assets and asset classes. They found that momentum works well on almost everything. This prompted Fama and French, two of the founders of efficient market theory, to call momentum the “premier anomaly” and to say that it is pervasive.
My first momentum research paper in 2011 applied relative strength momentum to stock market style, industry, and geographic sectors. I wanted to focus on equities because that is where the risk premium and investment returns have been highest over the long-run. I also reasoned it would be easier to apply momentum to market indexes or sectors rather than to individual stocks. This would also create less turnover and lower transaction costs than momentum applied to individual stocks. Academic research has shown that momentum applied to other asset classes is just as strong as momentum applied to individual stocks. Momentum used with geographically diversified stock indices are strongest of all. It is also more scalable than momentum applied to individual stocks.
I noticed that while relative momentum could lead to higher returns than buy-and-hold, it did nothing to reduce the drawdown risk during bear markets. In fact, bear market drawdown could be higher with relative momentum rather than without it. My first momentum paper dealt with this problem by including short and intermediate term bonds as additional asset classes. When the relative strength of stocks became less than the relative strength of short or intermediate term bonds, my model would switch into bonds. This greatly reduced portfolio left tail risk.
My next research paper in 2012, “Risk Premium Harvesting through Dual Momentum,” (winner of the 2012 NAAIM Wagner Award for Advances in Active Investment Management) expanded on what I had done earlier by identifying two types of momentum, relative and absolute.[2] Relative momentum compares the performance of an asset to that of its peers. Absolute momentum looks at an asset’s own performance (excess returns) across time.
Researchers had found that both types of momentum were robust and consistent across sub-sample periods. Both types of momentum gave higher risk-adjusted returns than buy-and-hold, and both held up well in extensive out-of-sample back tests. Besides comparing relative and absolute momentum, my 2012 paper introduced the concept of dual momentum. This is a synergistic approach that benefits from the enhanced returns achieved by using both forms of momentum together. It also had lower drawdowns that came from including trend-following absolute momentum.
There has been a massive amount of research on relative momentum over the past 20 years. In fact, relative strength/cross-sectional momentum has been one of the most researched areas in modern finance. But until recently there has been relatively little research done on absolute momentum. My 2013 paper “Absolute Momentum: A Simple Rule-Based Strategy and Universal Trend-Following Overlay” was an attempt to help balance that mismatch. Two of my more recent blog posts also focused on absolute momentum.
There is an 800-year backtest of a variation of absolute momentum in Greyserman and Kaminski’s book, Trend Following with Managed Futures: The Search for Crisis Alpha. The authors looked at 84 equities, fixed income, commodities, and currencies markets as they became available during the years 1200 through 2013. They established long or short equal risk-sized positions based on whether prices were above or below their rolling 12-month past returns. The average annual return of this trend following strategy was 13%, with an annual volatility of 11% and a Sharpe ratio of 1.16. In contrast, buy-and-hold returned 4.8% annually with volatility of 10.3% and a Sharpe ratio of 0.47. The worst drawdown for trend following was also significantly lower than for buy-and-hold.
Zakamulin compared absolute momentum to 3 different moving average methods applied to 155 years of stock market data. He found that absolute momentum performed best and was one of only two methods that beat buy and hold with statistical significance. The other was a reverse exponential moving average.
Our “Absolute Momentum Revisited” post was out-of-sample research of absolute momentum on U.S. stocks back to the year 1927. Although it could lag behind during prolonged bull markets, absolute momentum showed an overall higher Sharpe ratio, as well as substantially reduced volatility and drawdown compared to buy-and-hold. I concluded the post by saying, “Dual momentum, which uses both relative and absolute momentum, is still the premier momentum strategy for most investors, but absolute momentum may be a useful tool for some.”
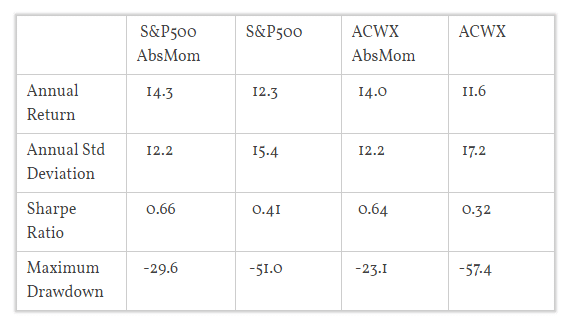
Here are the updated performance figures from 1974 through March 2015 for the absolute momentum part of dual momentum applied to the S&P 500 and MSCI All Country World Index ex-US (ACWI ex-U.S.) indices used in my Global Equities Momentum (GEM) model. The Barclays Capital U.S. Aggregate Bond Index is the safe harbor asset when absolute momentum exits equities. The GEM model is easy to use. Its sole parameter, the lookback period, was first published by Cowles and Jones in 1937 and has been validated in a number of academic studies since then.
Results are hypothetical, are NOT an indicator of future results, and do NOT represent returns that any investor actually attained. Indexes are unmanaged, do not reflect management or trading fees, and one cannot invest directly in an index. Please see our Performance and Disclaimer pages for more information.
We see that absolute momentum gives an impressive improvement in risk-adjusted performance compared to performance without the addition of absolute momentum.
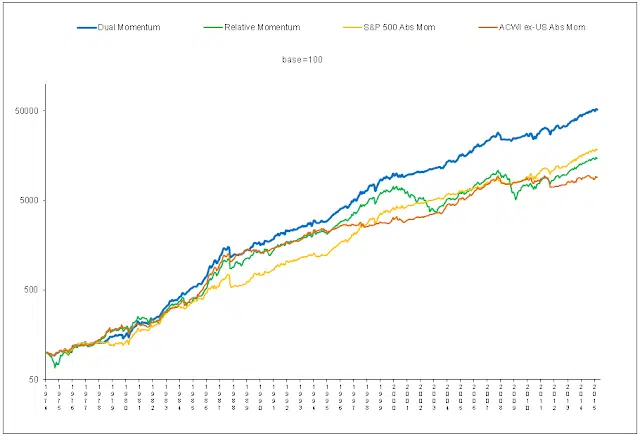
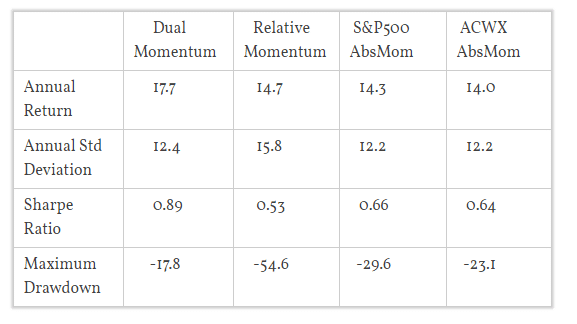
Next, we compare the performance of absolute momentum to the performance of relative momentum that switches between the S&P 500 and ACWI ex-U.S. indexes based on their relative strength. More importantly, we also see what happens when we combine both relative and absolute momentum, creating what I call dual momentum.
Results are hypothetical, are NOT an indicator of future results, and do NOT represent returns that any investor actually attained. Indexes are unmanaged, do not reflect management or trading fees, and one cannot invest directly in an index. Please see our Performance and Disclaimer pages for more information.
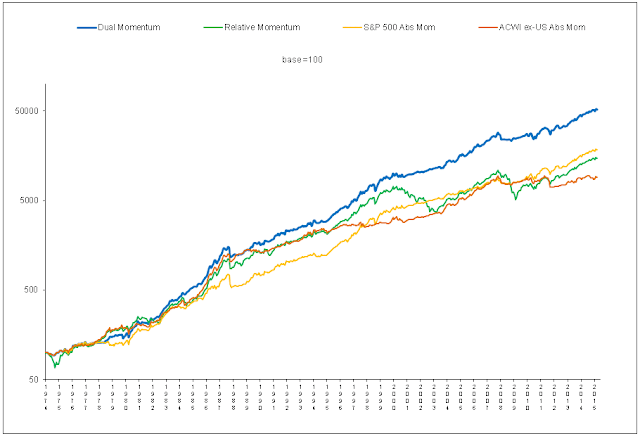
Relative momentum, like absolute momentum, gives higher returns than the indices themselves. Relative momentum, however, unlike absolute momentum, does nothing to reduce volatility and tail risk/worst drawdown. If forced to choose between relative or absolute momentum, I would choose absolute momentum. However, you do not have to pick one over the other. You can use both, and that is where the synergy happens – combining absolute and relative momentum to create dual momentum.
Dual momentum gives a large increase in average and risk-adjusted returns compared not only to the underlying indices but also to both relative and absolute momentum. The average bear market loss is around 34%. It takes a 50% gain to recoup that loss, and the average bull gain is about 10% per year. By attenuating or avoiding bear market losses, dual momentum can pick up where it left off by adding profits instead of having to recoup losses during the next bull market.
Dual momentum is the preferred momentum strategy. That is why I call this blog “Dual Momentum,” and my book Dual Momentum Investing: An Innovative Strategy for Higher Returns with Lower Risk.
[1] Geczy and Samonov (2012), for example, show that momentum was highly effective on U.S. equities back to 1801.
[2] Some academics refer to absolute momentum as time-series momentum. But both relative and absolute momentum are based on economic time series (asset prices).